What is Line Graph Maker?
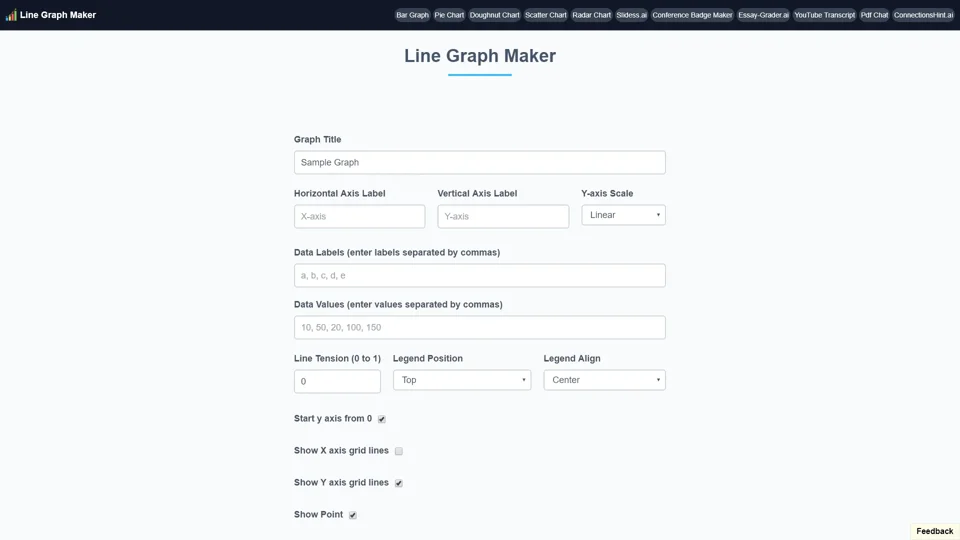
Line Graph Maker is a free online tool designed to help users create professional-looking line charts quickly and efficiently. It is part of a suite of AI-driven tools that aim to simplify data visualization for students, professionals, and anyone who needs to represent numerical data in a clear and concise manner.
Features of Line Graph Maker
-
Free to Use: The tool is completely free, allowing users to create unlimited line graphs without any cost.
-
Multiple Chart Types: Apart from line graphs, users can also create bar graphs, pie charts, doughnut charts, scatter charts, and radar charts.
-
Customization Options: Users can customize various aspects of their charts, such as:
-
Graph Title: Add a title to make your chart more descriptive.
-
Axis Labels: Define labels for both horizontal and vertical axes.
-
Data Labels and Values: Easily input data labels and corresponding values.
-
Line Tension: Adjust the smoothness of the line (from 0 to 1).
-
Legend Position: Choose where to place the legend (Top, Left, Bottom, Right).
-
Y-axis Scale: Select between linear and logarithmic scales.
-
Grid Lines: Show or hide grid lines for both X and Y axes.
-
Line Color: Customize the color of the line in the chart.
-
-
Data Visualization: The tool offers features like showing point markers and starting the Y-axis from zero for better data representation.
-
Download Options: Finished charts can be downloaded in PNG, JPG, or SVG formats.
How to Use Line Graph Maker
-
Add a Title: Provide a descriptive title for your graph to give context to the data.
-
Label the Axes: Define labels for both the horizontal and vertical axes to make the chart easier to understand.
-
Enter Data: Input data labels and values separated by commas. For example:
- Data Labels: January, February, March
- Data Values: 10, 20, 30
-
Adjust Line Tension: Choose a value between 0 and 1 to determine how smooth the line will appear.
-
Customize Legend Position: Select where you want the legend to appear (Top, Left, Bottom, Right).
-
Set Y-axis Scale: Decide whether to use a linear or logarithmic scale based on your data.
-
Start Y-axis from 0: Ensure the Y-axis starts from zero for accurate representation.
-
Show/Hide Grid Lines: Add or remove grid lines for X and Y axes to enhance readability.
-
Choose Line Color: Select a color for the line to make the chart visually appealing.
-
Download: Once satisfied with the chart, download it in the desired format (PNG, JPG, or SVG).
Pricing
The Line Graph Maker is completely free to use. There are no subscription fees or hidden costs. Users can create and download as many charts as they need without paying anything.
Helpful Tips for Using Line Graph Maker
-
Clear Titles and Labels: Always use descriptive titles and labels to make your chart easy to understand for your audience.
-
Choose Appropriate Scales: Selecting the right scale (linear or logarithmic) can significantly impact how your data is interpreted.
-
Use Grid Lines Wisely: Grid lines can improve readability, but too many can clutter the chart. Use them judiciously.
-
Play with Colors: Choosing the right color for the line can make your chart more visually appealing and professional.
-
Start from Zero: Always start the Y-axis from zero unless you have a specific reason not to, as it ensures accurate representation of data proportions.
Frequently Asked Questions (FAQs)
1. Is there a limit to how many line graphs I can create?
No, there is no limit. You can create as many line graphs as you need for free.
2. Can I use this tool without registering?
Yes, the Line Graph Maker is entirely free and does not require any registration or sign-up.
3. Is my data safe when using this tool?
Yes, the tool does not store any of your data. All processing is done in your browser, and once you close the window, your data is gone.
4. Can I create other types of charts besides line graphs?
Yes, the tool supports multiple chart types, including bar graphs, pie charts, doughnut charts, scatter charts, and radar charts.
5. How do I download the chart after creating it?
After customizing your chart, click on the "Download" button and select the desired format (PNG, JPG, or SVG).
6. Is this tool suitable for professional use?
Absolutely! The tool is designed to create professional-quality charts that can be used in reports, presentations, and publications.
7. Does the tool support real-time collaboration?
No, real-time collaboration is not currently supported. Each user must create their own charts individually.
8. Are there any ads or watermarks on the charts?
No, there are no ads or watermarks on the charts. The tool is completely free and unobtrusive.
9. Can I customize the fonts and font sizes?
Currently, font customization is limited, but the tool provides enough options to create clear and professional charts.
10. Is there a mobile app version of this tool?
No, the Line Graph Maker is currently available only as a web-based tool. However, it is responsive and works well on mobile devices.
